A property that you really like but it has only 60 years left or your own property is already 40
Continue reading
A property that you really like but it has only 60 years left or your own property is already 40
Continue reading
I was retrenched from my job around 3 months ago. It was not an easy experience for me as I
Continue reading
What comes as an exciting news for the Grab cab services is that the company now has more than 3000
Continue reading
Savings Bongs are a special type of Singapore Government Securities that is suitable for individuals who wish to diversify their
Continue reading
For those of you in Singapore, you might notbe too familiar with the company realme. They started out as a
Continue reading
The Vivo V17 Pro is the follow-up to the V15 Pro earlier this year, which was one of the first
Continue reading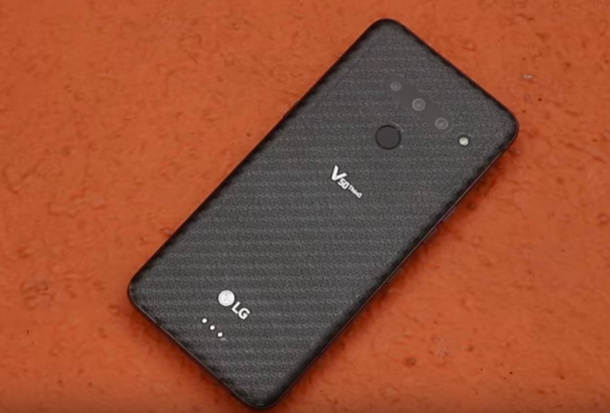
LG has had a rough couple of years, especially here in Singapore. Which is why I don’t really blame them
Continue reading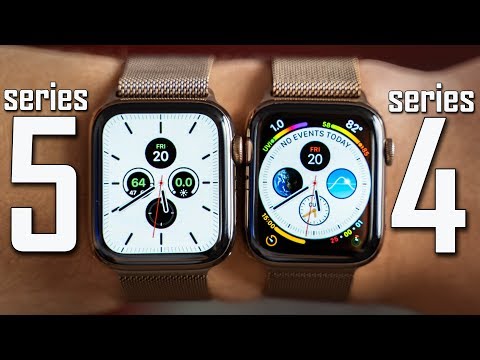
Today we’re going to be comparing all the little differences between the Apple watch series 4 and 5. If I
Continue reading
The iPhone 11 Singapore is finally here. There are a bunch of other colors including a new purple and green
Continue reading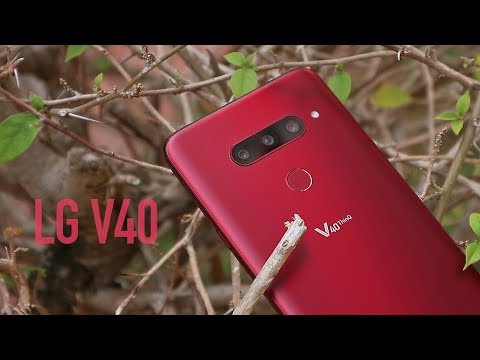
This is the LG V40. Since this isn’t really a new phone anymore, I’m just going to try and make
Continue reading